Nine years on, teams still rate their leader's care first and recognition last
The safety leadership behaviour teams rate most highly is the same one they rated most highly nine years ago: their leader’s care for the people in the team. The one they rate lowest hasn’t moved either. It’s recognition, and it comes last in every industry we measure, every region and every level of the organisation. We’ve asked the same eight questions ever since we published The State of Safety Leadership and The Safety Leadership Link. The sample has grown a long way since.
The job has also grown since we last published. Psychosocial hazards now carry explicit duties in all Australian jurisdictions, and much of what protects people from psychological harm at work (resources, support, encouragement, recognition and trust) arrives through the person they report to. Leaders are carrying more of the safety load than they were in 2017.
The shape of it
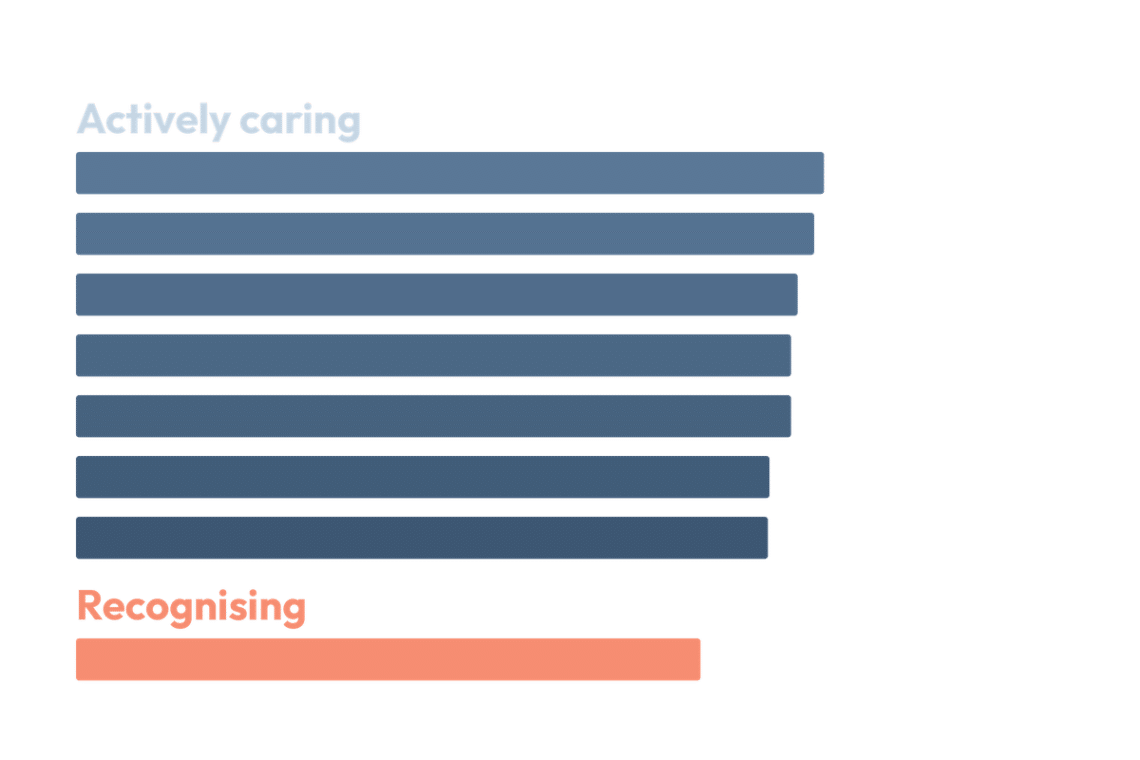
Care rates highest. Recognition runs last, and not one of the eight reaches good.
A third of people (33.9%) rate the leadership they get as poor.
Average rating of each competency on the seven-point scale, whole dataset. Finding 1 opens this up, filterable by industry, region and level.
How we measure it
Our research identified eight behaviours that define effective safety leadership. Drawn from transactional and transformational leadership literature, they have shaped the leadership component of our assessments for more than fifteen years.
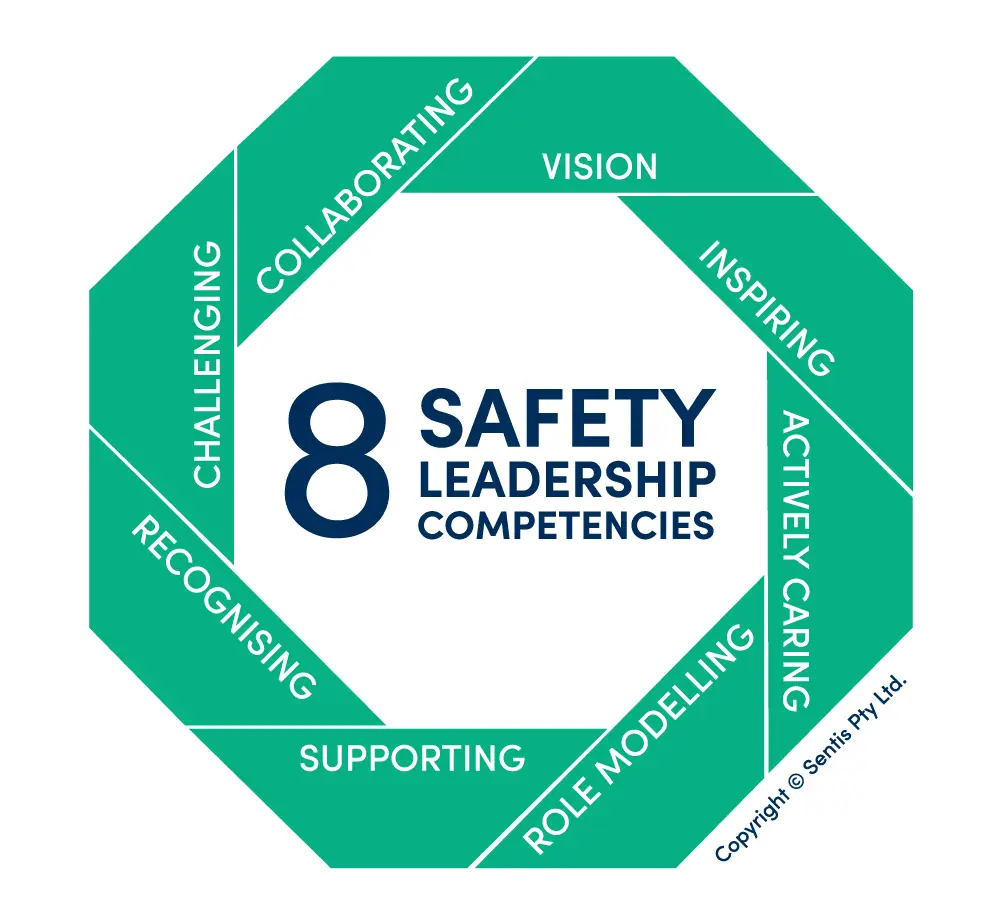
Tap or click a competency for its definition
Actively caring
Actively cares for the health, safety and general wellbeing of team members
Collaborating
Collaborates with the team to create shared ownership of safety and wellbeing
Supporting
Actively monitors safety performance and compliance with safety standards
Role modelling
Role models safety compliant behaviours that set the benchmark for the team
Vision
Shares a vision of the team's safety goals and the steps needed to achieve them
Inspiring
Inspires the team to achieve the safety vision through motivational communication
Challenging
Challenges team members to think about safety in ways they might not have considered
Recognising
Recognises and rewards employees for safe behaviour
Want to go deeper on each of the eight? Read our guide to effective safety leadership.
Ratings sit on a seven-point scale, which we group into three bands:
| Group | Score | What the person was saying | What it describes |
|---|---|---|---|
| Poor | Below 5.0 | Less than ‘slightly agree’ | The behaviours show up inconsistently or not much at all |
| Fair | 5.0 to below 6.0 | Between ‘slightly agree’ and ‘agree’ | The behaviours are present but not reliable |
| Good | 6.0 and above | ‘Agree’ or stronger | The behaviours are consistent and visible |
A band describes a pattern of behaviour, not a person or their safety record. Any leader can move between them, and plenty of people are rated poor with their commitment to safety fully intact. More often, they’ve never been shown what the behaviours look like in practice, or they’re carrying a workload that squeezes the behaviours out.
Some charts later in this piece use a different scale. Each one is labelled where it appears. Want more detail on the sample, method and sources? They’re at the end.
What the data shows
Finding 1
Care still rates highest. Recognition still runs last.
Let’s start with what teams say their leaders do well.
Actively caring rates highest of the eight competencies, and highest within nine of the eleven industries in the dataset. We called this the most encouraging finding of 2017, and it has held for nine years: whatever else people say about the person they report to, they see the care. As we wrote then, a leader who genuinely cares about their people already has the motivation; the remaining competencies can be built on top of it. Every competency also sits slightly above its converted 2017 value. While only a small increase, it’s headed in the right direction.
The gap hasn’t moved, either. In 2017, Recognising was the lowest-rated competency, and it still is. It sits last in all eleven industries and all six regions, at every level from frontline employee to executive. In 2017 we could say that across six industries and four regions. Now it holds across eleven industries and six regions, with nearly three times the responses behind it.
Average rating of each competency on the seven-point scale. The zones are unequal because agreement starts at 5.0 — poor holds every shade of disagreement. Nine industries are charted; Government and Manufacturing are held out for sample size.
Not one of the eight competencies reaches good across the dataset. Seven sit together in fair, which means present but not something a team can count on.
Recognising sits on its own below that, in poor, and across the whole dataset, it’s the only one of the eight that sits there. In practice, that’s the difference between a behaviour people see sometimes and one they mostly don’t. Filter by industry and the levels shift, some sitting stronger than others, but the shape barely moves: recognition comes last in every one of them.
The gap has narrowed a little since 2017, from 0.54 points to 0.41, so it’s moving in the right direction, but not enough to reach a ‘fair’ rating.
The consistency in the data is what indicates that many leaders find recognition the most difficult competency to master. Workplaces with almost nothing else in common land in the same place, which points to the work of leading itself, rather than to any one site or industry.
Why recognition is the hard one
Three things work against recognition, and none of them are about effort or intent.
- Danger announces itself. Safe work doesn’t. An unsafe act raises an alarm. A crew working carefully looks like nothing happening, so seeing it takes deliberate attention.
- Good work goes invisible. We tune out anything repeated. The safer a crew works, the less their leader consciously registers it. No incident, no trigger to pay attention.
- The systems point at failure. Audits, investigations and reporting are all built to catch what went wrong. Over years, that trains a leader to work like an inspector rather than a coach.
Finding 2
1 in 3 people rate the leadership they get as poor.
A third of people (33.9%) describe safety leadership behaviours that show up inconsistently at best. Another 37.8% describe behaviours that are there but not reliable. 28.3% describe leadership they can count on.
- Poor — below 5.0
- Fair — 5.0 to below 6.0
- Good — 6.0 and above
Ratings sit on a seven-point scale.
If you combine the poor and fair groups, that’s 71.7% of people are working under safety leadership that hasn’t yet become dependable. Not absent, but not something a team can count on.
The fair group is the largest of the three, and it doesn’t face the same problem as the poor group. The survey shows what teams see, not why they see it, so a leader still needs to work out what will move them from one group to the next.
Where people don’t agree the behaviours happen, the work is to establish them: what the behaviour is, when it applies, what it looks like on an ordinary Tuesday. Where people agree the behaviours happen but only mildly, the behaviours already exist and the work is to make them hold. The two need different conversations, and the same development rarely works for both.
Live webinar · Thursday, 26 November · 11am AEST
Go deeper into the data. Join Dr Amy Hawkes and Tia Armit as they take you through the data behind these findings: what's driving the patterns, how the results compare with 2017 and what the numbers can and can't tell us.
Finding 3
Stronger leadership ratings, stronger results on every measure.
Teams reporting stronger safety leadership also report stronger results everywhere we looked. The size of the effect varies, but the direction never wavers.
Overall safety climate is the big-picture number: the overarching score an organisation takes from a Safety Climate Survey.
There is a clear correlation between ratings of safety climate overall and ratings of safety leadership. Those that report poor safety leadership also report safety climate that averages at a counter-productive level. Those working for fair safety leaders report public compliance climate. Those that work for good safety leaders also report more positive safety climate, reaching private compliance.
Climate and leadership go hand in hand, climate shapes the leadership people expect and leadership shapes the climate people experience. Investing in one will produce improvements in the other.
- Poor leadership
- Fair leadership
- Good leadership
Shaded bands show where a score reads as poor, fair or good on that measure's own scale: below 5.0, 5.0 to 6.0 and 6.0 and above on the 1–7 scales; 4.0 and 5.0 on the 1–6 scales.
Climate measures1–7 scale
Psychological safety climate
How safe it feels to speak up and engage.
Critical risk climate
How strongly the workplace climate supports managing the risks that can cause serious harm.
Behaviour measures1–6 scale
Compliance behaviour
How consistently people follow safety procedures and standards.
Citizenship behaviours
The discretionary acts like flagging a hazard or helping a colleague.
Where the problem is discretionary (people not speaking up, hazards going unraised), leadership is the strongest lever in this data. Where the problem is compliance, leadership still matters, but the weaker relationship suggests procedures, supervision and site systems carry part of that load alongside it.
And the shape of the result repeats: across nearly every measure, the difference between poor and fair is larger than the difference between fair and good. For anyone planning how to use their development budget, that’s the order of operations: the biggest headroom sits with the leaders currently rated poor.
Taking this to your leadership team? Download the report as a PDF
Finding 4
Where leadership is rated poor, 43.6% say work harms their wellbeing.
This is the evidence we didn’t have in 2017: how work affects people’s wellbeing, split by the leadership people describe.
- Work harms my wellbeing
- No impact
- Work helps my wellbeing
Poor leadership
Fair leadership
Good leadership
Pressure to put production ahead of safety
Chart: percentage of people reporting pressure from their supervisor to put production ahead of safety. Poor leadership 27 per cent, fair leadership 9.7 per cent, good leadership 5.1 per cent.When leadership is rated poor, 43.6% of people say work harms their personal wellbeing; when leadership is rated good, that falls to 15.6%. Positive wellbeing moves in the opposite direction, rising from 17.6% to 46.6%. Pressure to put production ahead of safety shows the same pattern: 27% under poor leadership, compared with 5.1% under good leadership.
That’s the figure worth carrying into a board conversation. Australian regulators have finished phasing in explicit duties to manage psychosocial hazards, jurisdiction by jurisdiction. Victoria’s regulations, the last of them, commenced on 1 December 2025. Policies and surveys are now common. Named, testable controls are rarer. This data says leadership capability is one of them, and it puts a number on it.
It also gives safety and people teams a shared measure. The behaviours behind these figures (recognition, visibility, care and psychological safety) sit in both remits, and the leaders expected to deliver them usually get two sets of expectations and one set of hours. A shared measure is a start on a shared plan.
Finding 5
Under poor leadership, nearly twice as many incidents go unreported.
Split incident reporting by the leadership people describe and it moves a long way.
Share of incidents that go unreported
Chart: share of incidents that go unreported, by how people rate the safety leadership they receive. Leadership rated poor: 33.3 per cent of incidents. Fair: 21.7 per cent. Good: 18.3 per cent of incidents.Where leadership is rated poor, 33.3% of incidents go unreported. Where it’s good, that falls to 18.3%. Nearly twice the silence at one end of the scale as the other.
Reporting is often treated as a systems issue: is the form too long, and do people understand the process? Those things matter. But within the same organisation, using the same form, reporting rates shift with how people rate the leader receiving the report. Reporting that stays flat after repeated system fixes points somewhere other than the form: at what happens to the person who submits it. And that moment can be coached.
Where to act
Measure first
Without a measure, development budget follows instinct: the loudest gap or the most recent incident. A measure taken first does two jobs. It shows where the gaps are (which competencies, for which leaders), so the investment lands where it’s most effective. And it sets the baseline, because a program without a starting measure can’t show what changed.
There’s more than one way to get it. Our own tools include the Safety Leadership Assessment, which captures leaders’ own perceptions of their safety leadership, and the Safety Climate Survey, the larger survey behind this report. This captures employee perceptions of the leadership they receive as well as the climate factors. You may already hold data that can surface the same insights: an engagement survey with leadership questions, or a culture survey already in the calendar. Whatever the source, take the measure before the development starts. That’s what makes it a baseline. Re-measure on the same instrument afterwards and the return is visible instead of assumed.
Start with recognition
Recognition has ranked last everywhere for nine years running. The upside is it’s skill, not a trait, so there’s a practical place to start.
Effective recognition is timely, specific and grounded in real behaviour: notice one safe action as it happens and explain why it mattered. Instead of saying, ‘good job on safety this month’, say, ‘you stopped that lift when the load shifted, and that’s exactly what we want’. It must also feel genuine; performative recognition can damage trust more than silence.
Our 2017 report outlined five steps for strengthening recognition. They are still relevant because the finding has remained consistent:
- Decide what deserves recognising. List the behaviours you want repeated (a hazard raised early, a job paused to reassess) and make sure the list points at safety rather than speed.
- Know your options. Recognition runs from a quiet word in the field to a call-out at the toolbox meeting, and public and private land differently with different people.
- Go looking. Safe work doesn’t announce itself, so time in the field is the only reliable way to catch it happening.
- Match the moment to the person. Some people value the public mention; others want it one-on-one.
- Do it soon. Recognition loses its charge as the moment recedes; same day beats next toolbox.
One caution from the same report: recognition aimed at the wrong behaviour trains the wrong behaviour. Praise a crew for the workaround that got the plant running and you’ve just recognised the corner they cut. The list in step one is what keeps the instinct honest.
Coach the middle for consistency
The 37.8% rated fair are the largest group, and their teams already see the behaviours. The development question is how to keep those behaviours showing up when the week gets tough, and the answer usually lives inside rhythms that already exist rather than in new rituals competing for the same hours. A prestart already happens every morning; the version that builds consistency adds sixty seconds of yesterday’s specifics (what went right, who caught what) so the crew hears the behaviours named on ordinary days, not just after something goes wrong.
Our 2017 report called the underlying principle attention density: repeated, varied attention to the same priority is what turns a behaviour into a habit. Both words carry weight. Repetition without variation fades into wallpaper (the leader who closes every prestart with ‘let’s all be safe out there‘ is repeating, not reinforcing), so change the angle: ask the crew which risk worries them most this week, or have people share what they’re staying safe for. It applies to leaders every bit as much as to their crews.
Put leadership capability in the controls column
Finding four makes the case, so this is where you put it into action. Where your psychosocial risk assessment names poor support, low recognition or production pressure as hazards, list leadership capability as a control against them, the way you would any other control. In practice that’s four entries in the register: the hazard, the capability listed against it, the upward measure attached as verification and a re-measure date. Most registers already apply that discipline to hard controls; the shift is extending it to a human one.
None of this asks for a personality transplant. The behaviours that separate a poor rating from a good one are ordinary ones done consistently: actively caring, role modelling and supporting, shown on ordinary days rather than saved for a crisis. The picture in 2017 and the picture now both say few organisations have made them routine. Nine years on, the opportunity is still there.
Ready to work on the gap? Developing safety leaders is what we do, and this report is where that work starts: measure first, then build where the opportunity is. We're happy to talk it through, whether or not it goes anywhere.
Method
The sample
Every figure on this page comes from the 2026 Sentis Safety Climate Survey aggregate: 23,595 responses across eleven industries and six regions, each person rating the safety leadership of the person they report to across eight competencies on a seven-point scale. The aggregate is stratified so each client organisation appears once. Organisations that have surveyed with us more than once contribute a single dataset, which stops any one client, or any one frequently surveyed client, from being over represented in the data.
Who's in it
Mining (7,397 responses) and Utilities (6,030) together make up 57% of the sample. Australia makes up 51%. This is a picture of safety leadership in heavy industry, weighted towards Australian mining and utilities and seen mostly from the frontline. Government and Manufacturing responses sit inside the overall figures; we hold them out of the industry filter because their samples are too small to report on their own.
Comparing with 2017
The survey’s response scale changed from six points to seven in 2023, so results collected on the earlier scale, including the published 2017 benchmarks (8,212 responses, six industries, four locations), were converted to the 1–7 scale before any comparison. The conversion is linear, which keeps the order of the competencies and the gaps between them comparable across years. The small across-the-board rise since 2017 is best read as indicative rather than exact.
The outcome measures
Safety climate, psychological safety, citizenship behaviours, compliance and critical risk climate all come from modules of the same Safety Climate Survey, answered by the same people who rated their leaders. Not every organisation runs every module, so sample sizes differ between measures.
What this data can and can't say
The survey is cross-sectional: it captures leadership ratings and outcomes at the same moment, so it shows how outcomes differ with the leadership people describe, not what causes what. We’ve written the findings with that in mind.
Leadership self-perception data referenced comes from the Sentis Safety Leadership Assessment. Survey items are proprietary and remain the intellectual property of Sentis Pty Ltd.
Sources
- WorkSafe Victoria. Occupational Health and Safety (Psychological Health) Regulations 2025, commenced 1 December 2025.