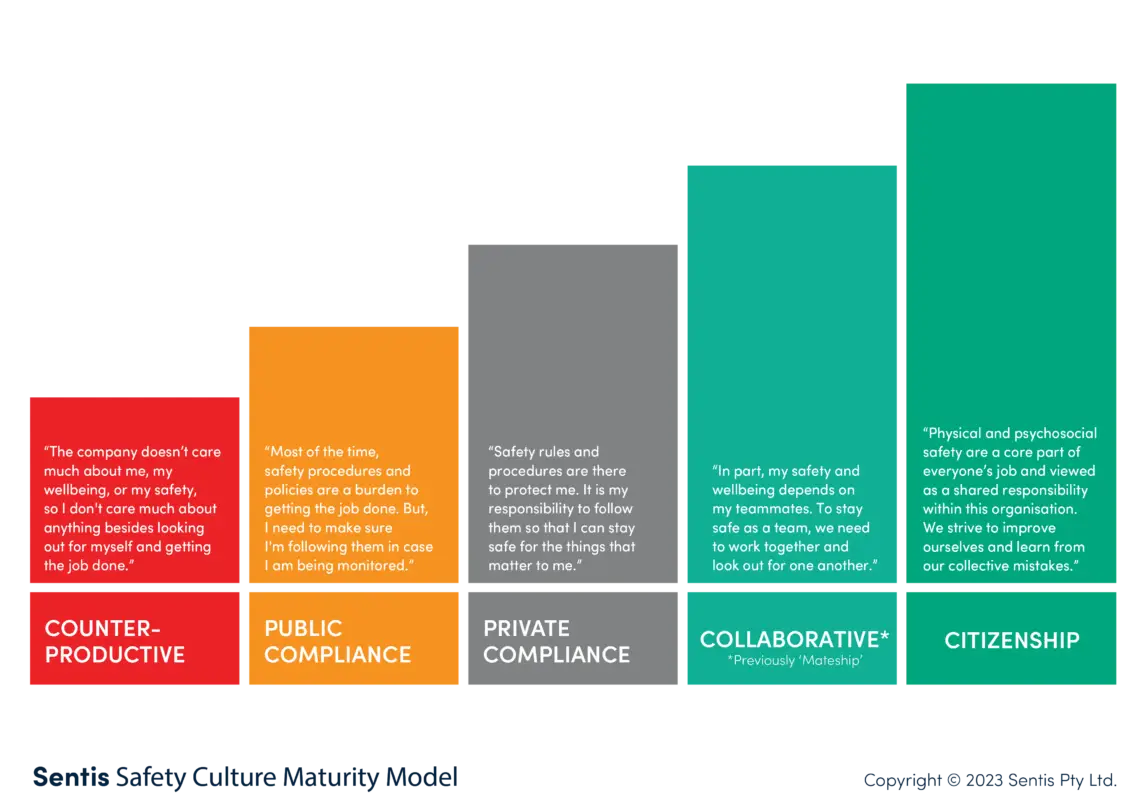
In pursuit of safety excellence, businesses invest huge amounts of money, time and energy in safety improvement initiatives. However, relatively few can pinpoint the positive effect of these on their safety culture.
So, how should you track the effectiveness of safety interventions and improvement in safety culture?
Previously, focus has been on the reduction of lag indicators such as lost time injury (LTI) rates, or total recordable injury (TRI) rates. While these can be tracked and measured to show improvement (or not) as well as impact on the company’s bottom line, are they the best way to measure safety improvement?
Lag indicators tell us, after the fact, how many people were injured in a way that impaired their ability to work for at least one shift. Many businesses rely on lag data for reporting as it is familiar and easy to measure—but it only provides one piece of the puzzle. When used in isolation, it doesn’t provide a clear picture of safety performance or improvement.
If we are truly striving for safety excellence and a culture where risks are managed, and injuries and incidents are prevented, we need to turn our focus to proactive lead indicators.
Safety Lead Indicators
Lead indicators precede a future event, and typically track and measure activities undertaken to prevent and control injury. Lead data can help organisations improve future performance by identifying weaknesses and allowing action before a failure occurs. Examples of lead indicators include:
- safety training,
- audits,
- safety observations/interactions,
- engagement in safety initiatives,
- reporting of near misses,
- hazards identified and controlled,
- housekeeping standards and so on.
Lead indicators offer a more complete picture of progress towards safety culture excellence by tracking the increase in positive employee behaviours. They complement the use of lag indicators and when looked at together, provide a clearer picture of safety performance.
While many will need to continue to report on lag indicators, the switch in focus from lag to lead can have a positive impact on safety culture.
Imagine a site where employees are committed to safety, look out for one another, invest energy in controlling hazards and report opportunities for improvement. We can track these positive safety behaviours to offer support for existing safety initiatives and provide employees with positive feedback about what they are doing well. This helps to paint a picture for employees to see the positive behaviours that are expected from them, rather than focusing only on what to avoid.
It can be challenging for organisations to develop and implement lead indicators, as they must be able to be accurately measured, relevant to the organisation’s strategy, appropriate to the level of safety culture maturity, and accepted by both leaders and team members.
Consider the following questions when deciding what lead indicators are right for your business.
What is your organisation’s level of safety culture maturity?
If your organisation has a relatively immature safety culture, lead indicators can be focused on compliance to collect basic data showing that a system exists and is being used. For example, the number of safety training hours completed, the quantity of hazard reports completed etc.
However, as your organisation’s safety culture matures, lead indicators will need to be modified accordingly. At higher levels of safety culture maturity, organisations can shift the focus beyond compliance and begin to measure the effectiveness of systems as well as opportunities for improvement.

How are your lead indicators linked to your lag indicators?
Leaders and employees need to see value in lead indicators, and believe that an improvement in lead indicators will result in an improvement in lag indicators or overall safety performance. If a clear link cannot be seen between the lead indicator and overall safety results, then it’s unlikely that leaders or employees will invest energy in the system.
What process will your organisation follow to make improvements to safety culture, based on lead indicator data?
Consider how your organisation will use the information collected from the activities you are measuring to improve safety. For example, if you measure hazard identification or safety observations/interactions, leaders and employees must be clear on how the data from these activities is used to improve safety. If leaders or employees don’t understand the process, or worse, feel there is no process and see no evidence of your organisation using the data from these activities to make changes and improvements to safety, then engagement will be low.
Lead indicators can complement lag indicators to provide an overall picture of your organisation’s safety performance. However, lead indicators need to be carefully considered and developed to suit your organisation’s level of maturity and areas of opportunity. It’s also important to remember that collecting data alone does not improve safety performance. Leaders need to ensure prompt action to address areas of improvement as well as reinforce strengths and positive safety behaviours and results.
Contact us to benchmark your safety maturity and discover how we can help improve safety culture in your business, leading to improvements in lead and lag indicators and therefore bottom line ROI.


